A user opens a ticket: "Business Central is slow." That's the entire report. Not which page, not what action, not whether it's slow for one person or everyone, not whether it started yesterday or has been creeping up for months. And yet that vague ticket usually triggers the same reflexive response — restart the service tier, maybe bump the App Service plan, hope it resolves itself.
Sometimes it does, temporarily. It almost always comes back, because "restart it" treats a symptom without ever identifying a cause. Business Central actually ships with real diagnostic tooling built specifically to answer "which of the following four things is actually happening" — most IT teams just haven't turned it on.
Stop Guessing. Turn On Telemetry First.
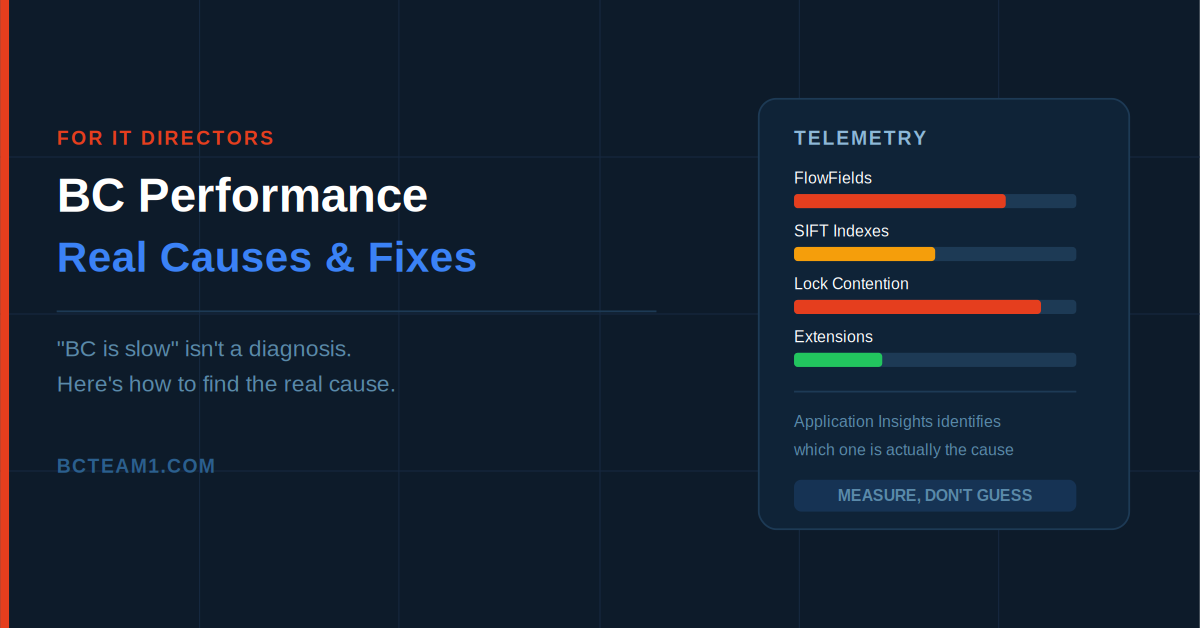
Before chasing any specific fix, the single highest-leverage step is connecting your environment to Azure Application Insights. Once enabled, Business Central emits detailed telemetry covering long-running SQL queries, lock timeouts, deadlocks, and page load durations — the exact signals needed to tell these four causes apart instead of guessing.
Microsoft's own guidance here is specific: baseline your environment with telemetry before changing anything, then make changes and compare against that baseline. Without it, "we made it faster" is a feeling, not a measurement — and it's impossible to tell whether a fix actually worked or the problem just moved somewhere else.
Cause 1: FlowFields Calculating More Than They Need To
FlowFields — the calculated fields showing sums, counts, and lookups like a customer's balance — are one of the most common sources of page-load slowness, specifically because each FlowField calculation can require its own separate SQL query against potentially millions of underlying ledger rows.
The classic failure pattern: a list page shows several FlowField columns, and every one of them recalculates for every visible row, every time the list refreshes. On a small customer list, nobody notices. On a list with thousands of records and several FlowField columns, that's a genuinely heavy amount of database work disguised as "just opening a page."
The fix: Reduce the number of FlowFields shown directly on high-traffic list pages — move less-critical totals to a FactBox or drill-down instead of a default column. Enable the Calculate only visible FlowFields feature so fields that aren't currently shown don't calculate anyway. And ensure the underlying SIFT indexes actually exist and are properly maintained for the sum/count FlowFields you do keep visible — a missing or disabled SIFT index turns what should be an instant lookup into a full table scan.
Cause 2: Missing or Disabled SIFT Indexes
SumIndexField Technology (SIFT) is what makes a field like a customer's running balance open instantly instead of recalculating from scratch across every ledger entry that's ever posted. Each SIFT definition becomes an indexed structure in the database that pre-aggregates those sums.
The tradeoff is real: every maintained SIFT index adds write overhead, since the database has to update it on every insert, modify, and delete against the base table. This means the fix isn't automatically "add more SIFT indexes everywhere" — high-volume transaction tables in particular, like Item Ledger Entry, can actually slow down posting if too many SIFT structures are being maintained on fields nobody reads often.
The fix: Audit which SIFT-backed totals are actually viewed frequently versus rarely, and disable maintenance on the ones that aren't earning their write-overhead cost. This is a genuine balancing act, not a one-directional "add more indexes" exercise — and it's exactly the kind of thing telemetry data should inform rather than guesswork.
Cause 3: Lock Contention, Not Actually Slow Queries
A query that looks slow in a report isn't always slow because of the query itself — it's often waiting on a lock held by something else. Posting routines, warehouse activity, job queue entries, and integrations running concurrently can all hold locks long enough to stall unrelated user sessions, and this shows up to end users as generic sluggishness with no obvious cause.
This is a specifically common pattern worth naming directly: performance that's noticeably worse at certain times of day — heavy posting activity in the afternoon, a scheduled job queue task running during business hours — is a strong signal of lock contention rather than a fundamentally slow query.
The fix: Application Insights telemetry specifically surfaces lock timeout and deadlock events, which is the fastest way to confirm whether users are actually waiting on locks rather than raw query time. Once confirmed, staggering heavy job queue tasks away from peak business hours is often the single highest-impact, lowest-effort fix available.
Cause 4: A Handful of Extensions Doing More Work Than Anyone Realizes
Most Business Central environments run several extensions layered on the base platform, and it's genuinely difficult to know, just by looking at a slow page, which extension — if any — is contributing to the problem. Business Central's built-in Page Inspection tool exists specifically for this: it shows a page's source table, its fields including FlowFields, and which installed extensions are adding fields, parts, or FactBoxes to that specific page.
The fix: When a specific page is slow, use Page Inspection first to see exactly what's loading on it — heavy FlowField counts, multiple FactBoxes, custom fields from several different extensions stacking up. Combine that with the built-in performance profiler under Troubleshooting to measure exactly where time is spent when the slow action is performed, rather than guessing which of several installed extensions might be responsible.
What a Real Diagnostic Process Looks Like
Put together, a genuine performance investigation looks like this: enable Application Insights and establish a baseline. When a specific complaint comes in, check whether it's a long-running query, a lock wait, or a page loading too many FlowField calculations — the telemetry data distinguishes between these directly rather than requiring a guess. Use Page Inspection on the specific slow page to see what's actually loading. Only then decide whether the fix is a SIFT index change, a FlowField visibility change, a job queue schedule change, or an extension that needs attention.
None of this requires exotic tooling — it's built into the platform and largely underused, because "restart the service" is faster to try even though it rarely addresses the actual cause.
Where to Start
If Application Insights isn't currently connected to your environment, that's the first thing worth fixing — everything else in this list depends on having that signal available. From there, the next time a specific page or action is reported as slow, resist the urge to guess and instead run it through Page Inspection and the performance profiler before deciding what to change.