It's the night before the board meeting, and the Controller is still reformatting a P&L in Excel — pulling the trial balance out of Business Central, restructuring it to match last quarter's layout, manually adding a budget comparison column, and double-checking that a formula didn't break when a new G/L account got added last month. This happens every quarter, at nearly every company, and it's almost entirely unnecessary.
Business Central ships with a genuinely capable reporting engine — currently called Financial Reports, though it was known as Account Schedules for years and plenty of long-time users still call it that — built specifically to produce exactly this kind of custom, board-ready financial statement natively, without an Excel rebuild every period. Most companies either never configured it past the four default statements or built something once and let it go stale as the business changed.
What Changed, and What Didn't
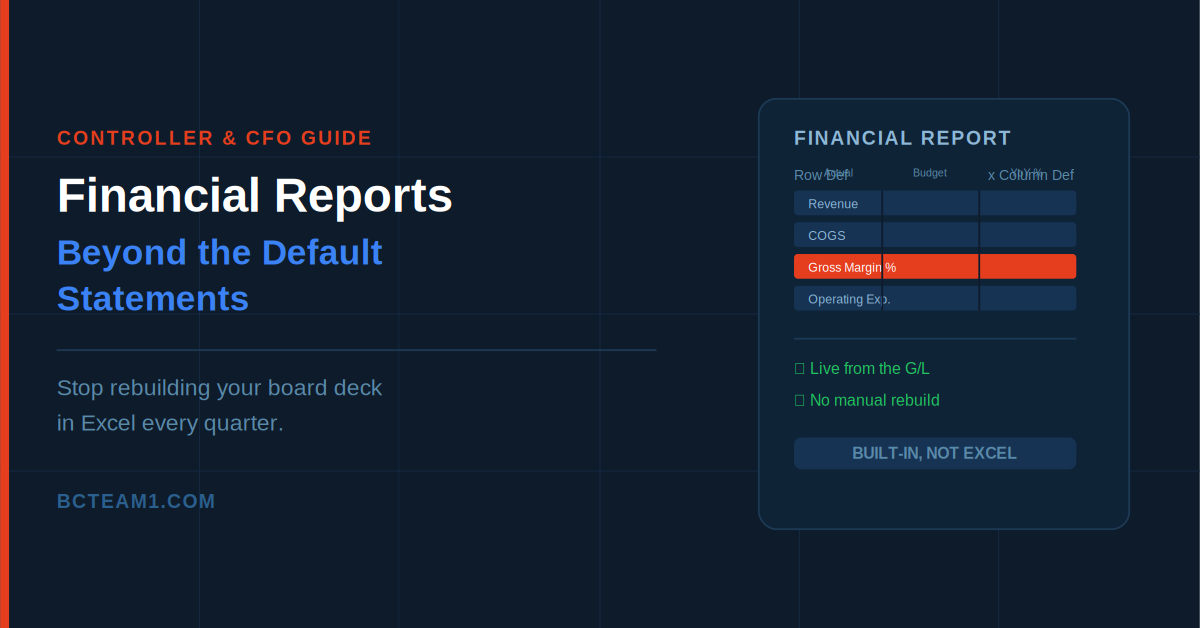
Microsoft renamed Account Schedules to Financial Reports in 2022, splitting what used to be one combined object into two separate, reusable pieces: Row Definitions (what used to be called the account schedule itself) and Column Definitions (formerly column layouts). A Financial Report is now simply a named combination of a row definition, a column definition, and a set of runtime parameters — which makes it much easier to reuse the same row structure across several different column layouts, or vice versa, instead of duplicating an entire report every time you need a variation.
The underlying capability is the same one that's existed for years. What's new is that rows and columns can be built, edited, and reused independently — which matters a lot once you're maintaining more than one or two custom reports.
Why the Four Default Statements Aren't Enough
Business Central ships with built-in Balance Sheet, Income Statement, Cash Flow, and Retained Earnings reports, and they're a reasonable starting point — but Microsoft is explicit that these sample reports "aren't ready to use out of the box." They're templates, built against a generic chart of accounts and generic G/L account categories, not your specific business.
The moment your reporting needs go beyond a plain trial balance — segmenting by department, comparing actual to budget to a reforecast side by side, building a trended twelve-month view, or presenting a management report with subtotals that don't map cleanly to your statutory statement structure — the default reports stop being useful without real customization. That customization is exactly what Row and Column Definitions are built for.
What Row Definitions Actually Control
A Row Definition determines what appears on each line of the report and where the underlying numbers come from — a specific G/L account, a range of accounts, a G/L account category, or a calculated value built from formulas referencing other rows. This is where the real customization power lives: a well-built row definition can present a management-style income statement with subtotals and calculated margins that look nothing like a raw trial balance, while still pulling live numbers directly from the G/L underneath.
Rows can also reference each other — a "Gross Margin %" row calculated as a formula referencing a Revenue row and a COGS row above it, for instance — which is exactly the kind of derived metric that normally requires manual Excel formulas rebuilt every period, except here it updates automatically every time the report runs.
What Column Definitions Actually Control
Column Definitions determine what kind of amount displays in each column — net change for a period, balance at a specific date, or a formula comparing two other columns — along with the date range and comparison logic for each. This is where actual-vs-budget, this-year-vs-last-year, and month-over-month trend comparisons get built, and critically, a single row definition can be paired with several different column definitions to produce genuinely different report views without rebuilding the underlying row structure each time.
A practical example: one row definition for a summarized income statement can pair with one column definition for a simple month-to-date view, and a completely different column definition for a twelve-month trend — same rows, two different reports, no duplication of the row logic itself.
The Setup Most Companies Skip
Getting real value out of this requires a bit of upfront configuration most implementations skip under time pressure: G/L Account Categories need to be assigned consistently so row definitions referencing categories actually pull the right accounts, and Dimensions need to be used consistently enough that reports segmenting by department or location actually produce trustworthy numbers. Skipping this groundwork is the most common reason a company tries Financial Reports once, gets a report that doesn't look right, and quietly goes back to building everything in Excel instead of fixing the underlying setup.
What This Looks Like Done Right
A properly built set of financial reports means the Controller opens Business Central the morning of a board meeting, selects the report already configured with this quarter's comparison logic, and exports directly to Excel if a specific formatting touch is still needed — rather than rebuilding the entire structure from a raw trial balance the night before. The underlying G/L is the single source of truth the whole time; nothing gets reconciled after the fact because nothing was manually re-keyed in the first place.
Where to Start
If your team is still exporting a trial balance and rebuilding it in Excel every close, it's worth auditing three things: whether your G/L Account Categories are assigned consistently enough to support category-based row definitions, whether Dimensions are clean enough to support the segmented views you actually need, and which specific recurring Excel reports could be replaced by a properly built row-and-column combination. Most companies find that two or three well-built reports eliminate the vast majority of the manual rebuild work happening every period.